Grafana
Grafana is the dashboard system of choice in which we are going to be able to watch all logs. The Grafana instance used in this project is preconfigured and has already setup dashboards for you to inspect.
Head over to http://localhost:3000/dashboards and select BA Websocket Server to inspect the metrics provided by the custom websocket server.
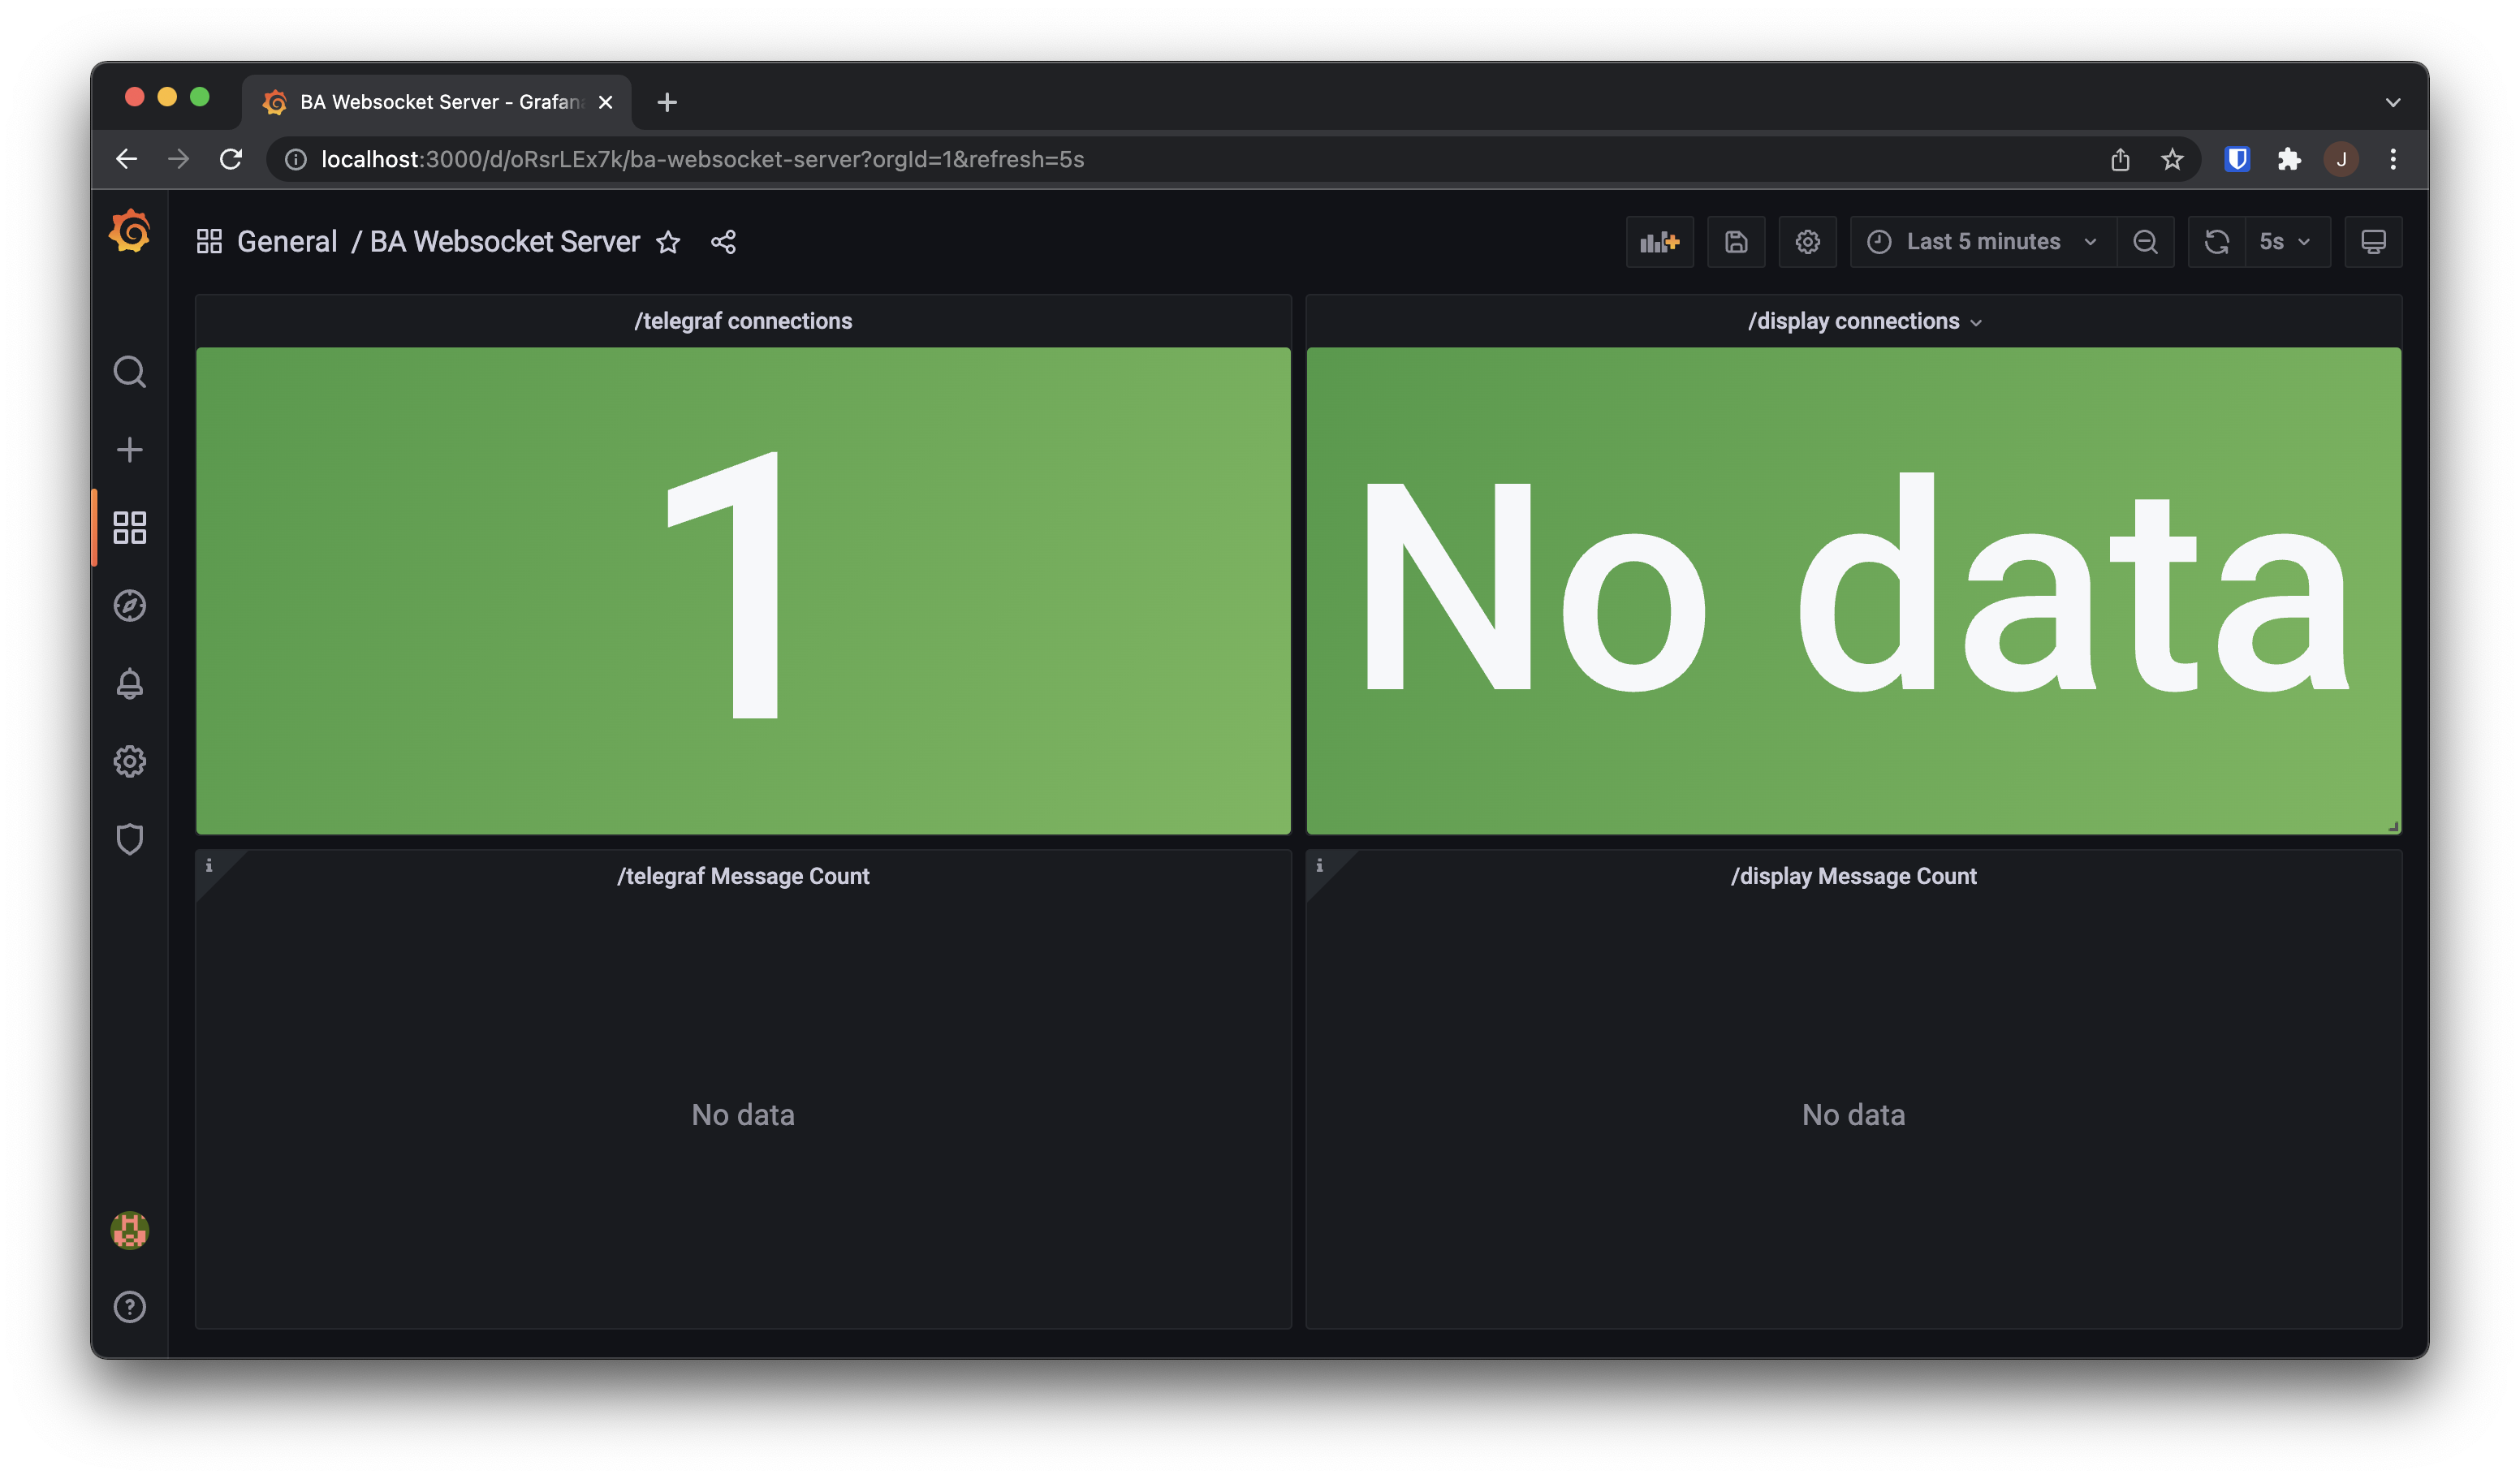
The upper left tile describes how many connections are established to the /telegraf endpoint of the custom websocket server. The lower right tile describes how many incoming messages the /display endpoint received.